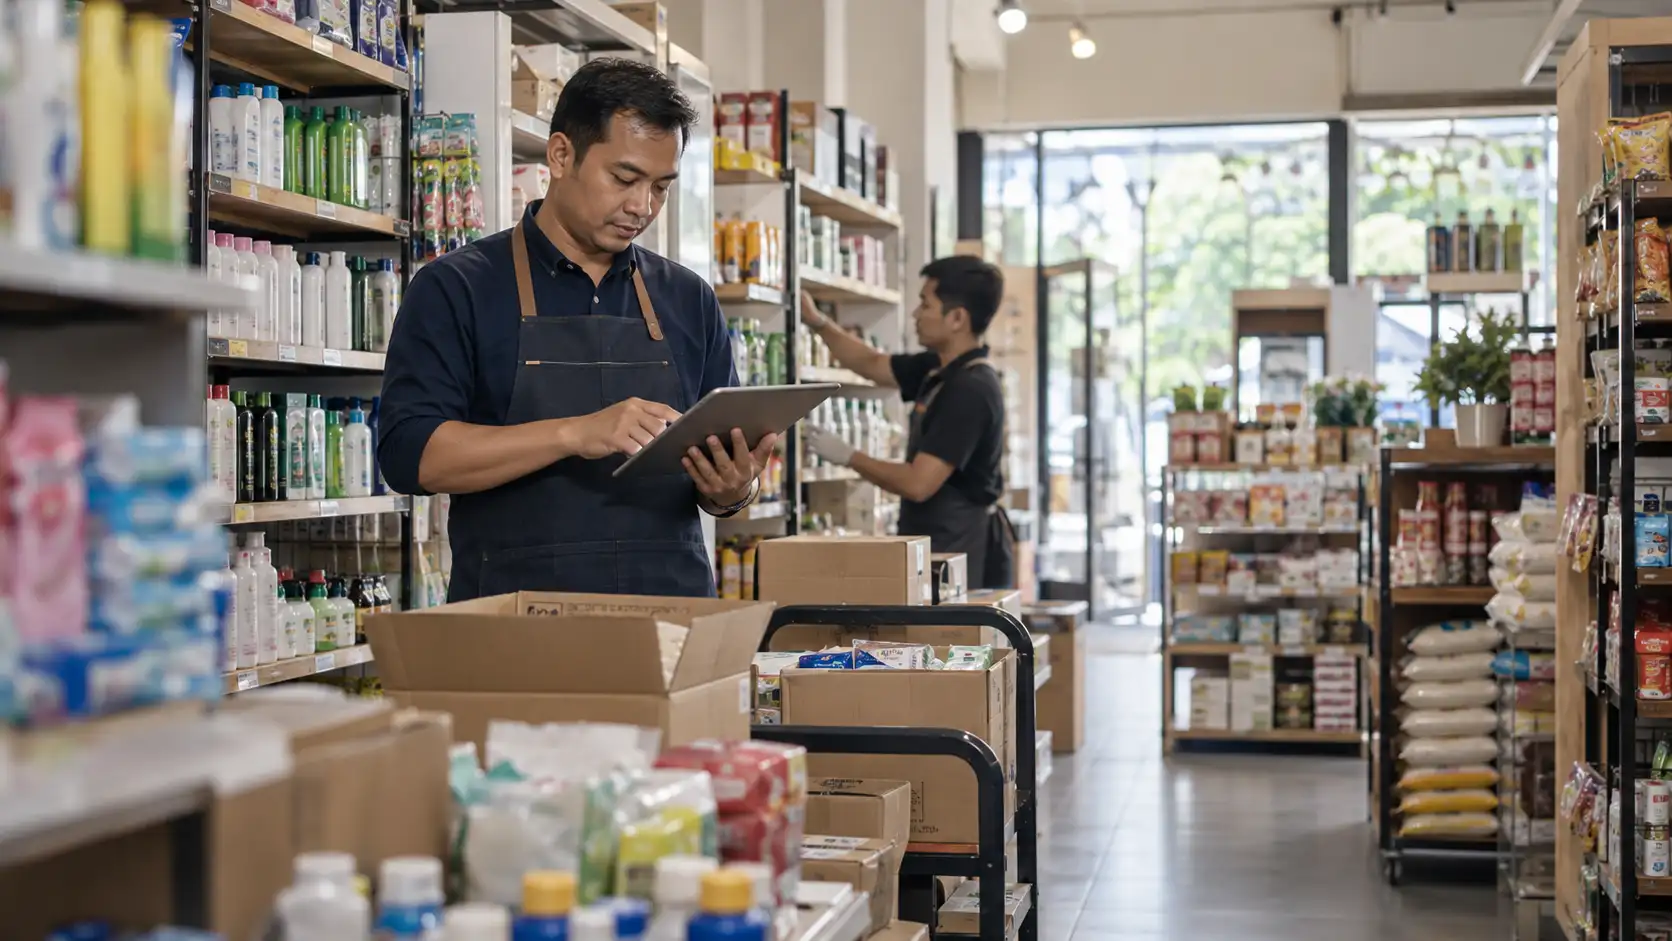

For a small retailer, national retail growth of one or two percent can feel distant from daily reality.
The owner still has to decide what to restock, which products are slowing, how much cash is sitting on shelves, and whether higher sales are producing healthy margins.
Those questions matter ahead of Bank Indonesia’s full July 2026 Retail Sales Survey, scheduled for publication on September 10.[1]
BI has already published its preliminary estimate.
The Real Sales Index for July is expected to reach 224.4, representing 0.9% year-on-year growth.[2]
Food, beverages and tobacco are expected to be among the main drivers, alongside positive growth in spare parts and accessories as well as other household equipment.[2]
Month on month, however, retail sales are expected to decline 0.3%, partly reflecting normalisation after religious holidays and school breaks.[2]
Retail can therefore grow annually while softening from the previous month.
There is no contradiction.
The 0.9% headline is only the starting point
Aggregate sales growth provides direction.
Category movement provides more useful business information.
The preliminary BI data points to food, beverages and tobacco as an important contributor, with spare parts and household equipment also recording positive growth.[2]
That does not mean every business in those categories is growing.
National retail indicators are aggregates.
A local grocery shop, household retailer, or automotive-accessory store can experience very different results.
The value of the macro data is as a benchmark.
Annual and monthly growth tell different stories
A 0.9% annual increase means July activity is expected to be modestly higher than July 2025.[2]
A 0.3% monthly decline means activity may be weaker than June.[2]
Calendar effects matter.
Religious holidays, school breaks and promotional periods can temporarily lift demand.
Small businesses that mistake a seasonal spike for permanent growth can easily over-order stock.
Inventory is another form of cash
Revenue is visible.
Slow-moving stock is less visible but equally important.
Products sitting on shelves tie up working capital.
Perishables can become waste.
Fashion can lose relevance.
Electronics can become obsolete.
Household products can absorb cash for months.
Retail performance should therefore be analysed alongside inventory turnover.
Not all categories deserve the same response
A simple approach is to separate products into three groups.
Fast-growing, fast-moving products require availability without excessive stock.
Stable but slowing products need diagnosis.
Weak products with poor margins require tougher decisions.
A spreadsheet can be enough.
The critical requirement is consistent transaction and stock data.
Sales growth does not guarantee healthy cash flow
A retailer can increase revenue and still create cash pressure if inventory grows faster.
This is why growth and cash conversion should be separated.
Businesses need to understand how quickly stock is sold, when suppliers must be paid, and when cash returns to the business.
For capital-constrained SMEs, the quality of growth often matters more than the headline growth rate.
Food growth still needs context
Food, beverages and tobacco are expected to support July retail activity.[2]
But stronger category activity does not guarantee equal pricing power.
Indonesia’s annual consumer inflation reached 3.19% in August.[3]
Households may continue buying essentials while changing brand, pack size, purchase frequency, or basket composition.
Demand can remain present while behaviour changes underneath it.
Watch the basket, not only the transaction
Retailers should ask what is happening inside each purchase.
Are customers buying more items?
Switching to cheaper SKUs?
Choosing smaller packs?
Reducing impulse purchases?
Responding better to bundles?
These signals help distinguish volume growth, price growth and product-mix effects.
SMEs have one important advantage: speed
Large retailers have sophisticated forecasting systems and stronger supply-chain leverage.
Small retailers can often react faster.
Owners see customer questions directly.
They can change displays in a day, reduce slow-moving orders, test smaller quantities, adjust bundles, or contact repeat customers.
That agility becomes valuable when it is supported by basic data discipline.
Use BI data as a benchmark, not a remote control
National retail data should not dictate operating decisions automatically.
If a category is strengthening nationally while your own sales are falling, examine your own pricing, availability, location, channel, competition, and customer experience.
Macroeconomic data describes the environment.
First-party data describes the business.
Four numbers worth watching
A useful small-business retail dashboard can begin with four metrics:
sales growth, gross margin, inventory turnover or days on hand, and repeat purchase.
Together, they explain far more than revenue alone.
What the final July report can add
Bank Indonesia’s complete July Retail Sales Survey is scheduled for September 10.[1]
The preliminary estimate already points to modest annual growth with uneven category performance.[2]
Once the full release is available, category details will matter more than the headline index.
For SMEs, the better question is not simply:
“Is retail growing?”
It is:
“Which categories are moving inside our business, how quickly does that stock turn back into cash, and is the growth profitable?”
That is where retail statistics become operating decisions.
- [1] Bank Indonesia. September 2026 Publication Calendar.
- [2] Bank Indonesia. “Retail Sales Survey July 2026: Retail Sales Expected to Increase.” 11 August 2026.
- [3] BPS-Statistics Indonesia. August 2026 Consumer Price Index release.
Published: September 6, 2026