
Consider the view from a small café, fashion retailer, or food business.
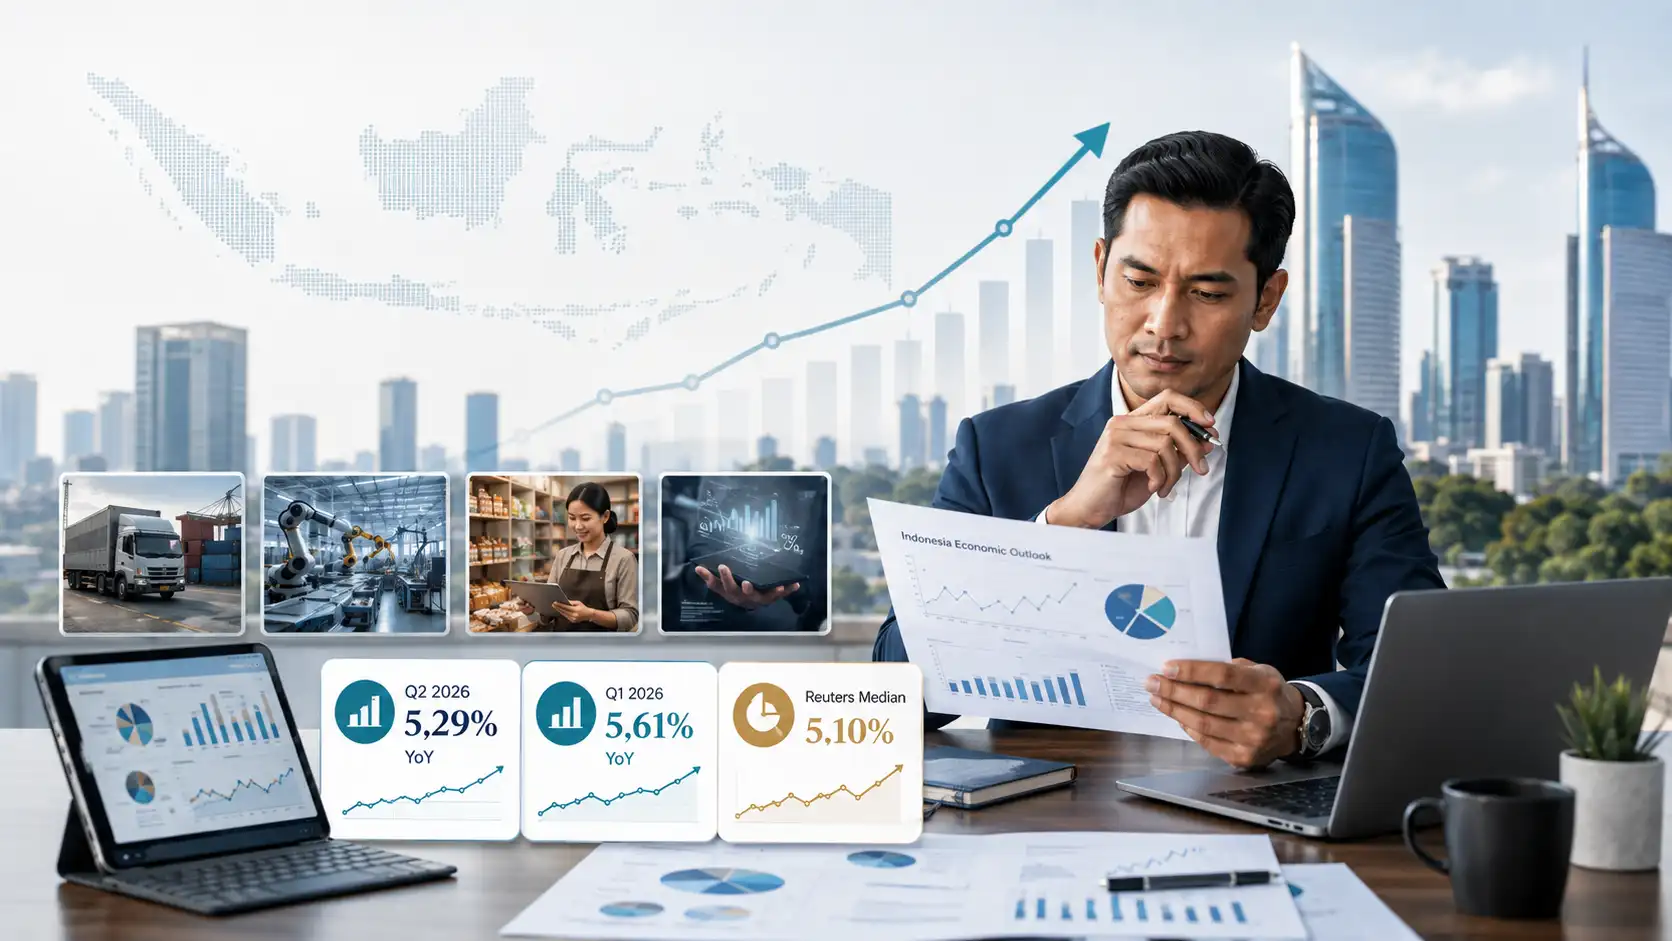
The owner reads that Indonesian household consumption expanded by 5.06% year on year in the second quarter of 2026. The broader economy grew by 5.29%.[1]
Then the owner looks at the cash register.
Transactions are not surging. Some customers appear more price-conscious. Certain products move quickly while others remain on shelves longer than expected.
Is the macroeconomic data wrong?
No.
The more likely explanation is that national household consumption and an individual company’s sales are measuring very different things.
Indonesia’s household consumption grew by 5.06% from a year earlier in Q2, although that was slower than the 5.52% recorded in the previous quarter.[1][6]
Bank Indonesia’s retail data present a more cautious monthly picture. The Real Sales Index stood at 223.4 in May but declined by 1.5% from April. When surveyed, retailers expected another 0.8% monthly decline in June, bringing the index to 221.6.[2] The June figure was a survey estimate at the time of publication, rather than a final realised number.
Both observations can be true.
Start by recognising that the numbers measure different things
The 5.06% household-consumption figure is year-on-year: Q2 2026 compared with Q2 2025.
The 1.5% retail contraction in May is month-on-month: May compared with April.
They have different comparison periods.
Their scope is also different.
Statistics Indonesia defines household final consumption expenditure as spending by resident households on goods and services for final consumption, excluding capital goods.[7] Consumption therefore extends far beyond purchases made at conventional retail stores.
Transport, accommodation, food services, communications, recreation and many other services can all form part of household consumption.
Bank Indonesia’s retail survey, meanwhile, monitors selected retail categories.
So a growing household-consumption number alongside softer monthly retail sales is not necessarily a contradiction.
It is two different windows into consumer activity.
Consumers can keep spending while changing where the money goes
There are indications that mobility-related spending played an important role during the quarter.
Reuters, citing official data, reported that household consumption in Q2 was supported in part by transport and hotel expenditure during school holidays.[6]
Tourism figures provide additional context.
Statistics Indonesia recorded 106.16 million domestic tourist trips in May, up 8.69% from a year earlier. Star-rated hotel occupancy reached 50.76%, an increase of 2.48 percentage points year on year.[4]
That is not enough evidence to declare a permanent structural shift from goods toward experiences.
It does, however, demonstrate an important principle for businesses.
Consumers do not have to stop spending for a particular retailer to feel pressure.
They merely have to change how they allocate their spending.
Money previously directed to a household product may instead go toward a family trip, restaurant visit, children's holiday activity or another service.
Aggregate consumption can grow even when some categories lose share of the consumer wallet.
For management teams, that changes the question.
Instead of asking only:
“Is purchasing power strong or weak?”
Ask:
“What are our customers choosing to spend on now?”
Confidence remains optimistic—but optimism does not mean indiscriminate spending
Bank Indonesia’s June Consumer Survey recorded a Consumer Confidence Index of 117.8.[3]
Because the reading remained above 100, consumers were still classified as optimistic.
Yet confidence had declined from 120.9 in May. The Current Economic Conditions Index fell from 112.2 to 109.2, while the Consumer Expectations Index declined from 129.7 to 126.4.[3]
That produces a much more nuanced picture than declaring the consumer simply “strong” or “weak.”
Households can remain broadly confident about the economy while becoming more selective in individual purchasing decisions.
For a brand, that might appear as longer price comparisons, smaller pack sizes, greater reliance on promotions, less frequent premium purchases, or willingness to pay only when the perceived value is obvious.
The national data cannot tell a company whether those behaviours are occurring among its own customers.
Its transaction data can.
Digital payments make buying easier—and comparison easier too
Another transformation is accelerating at the same time.
Bank Indonesia reported 16.07 billion digital payment transactions in Q2 2026, an increase of 36.88% year on year. QRIS transaction volume alone increased by 100.12%.[5]
Transaction growth should not be confused with an equivalent increase in consumer spending. Five small digital payments can replace one larger transaction.
But for businesses, the change is significant.
Friction in the purchasing process is falling.
Customers can pay for a small meal without cash, order food from home, compare competitors in minutes and evaluate price, reviews, promotions and delivery fees before making a decision.
Digitalisation makes commerce easier.
It also makes competition more transparent.
A good location may once have provided a substantial competitive moat. Location still matters, but digital reputation, visual presentation, customer reviews, payment convenience, delivery speed and service quality increasingly influence the decision.
For smaller companies, design, technology and operations are no longer separate disciplines.
They converge at one place:
customer experience.
A more selective customer should not automatically trigger deeper discounts
When sales slow, the easiest response is often a promotion.
Discounts have a role, but permanent promotional dependence brings its own risks.
It reduces margin, teaches customers to postpone purchases until the next promotion and can weaken perceptions of the normal price.
The alternative is not to abandon promotions.
It is to understand the occasion behind the purchase.
An F&B company may have customers buying an everyday meal and others purchasing for a family gathering. Their willingness to pay and product requirements are different.
A fashion business can distinguish between functional purchases, gifts, professional clothing and lifestyle purchases.
A creative-services business can separate customers seeking the cheapest execution from those paying for consistency, speed and strategic value.
As consumers become more selective, segmentation becomes more valuable than blanket discounting.
Five internal metrics can reveal more than the GDP headline
Smaller businesses do not need expensive analytics platforms to begin.
Start with five numbers.
Transaction count. Is revenue rising because more customers are buying, or merely because prices have increased?
Average transaction value. If customer numbers are stable but basket size is shrinking, customers may be trading down.
Repeat-purchase rate. Returning customers provide a very different signal from buyers acquired through one-time promotions.
Inventory turnover. Total revenue can look healthy while working capital remains trapped in slow-moving products.
True contribution margin. Include shipping, marketplace commissions, discounts, returns, payment costs and marketing—not only the difference between the selling price and raw materials.
These numbers often tell an owner more about the health of demand than a general statement that “the economy is doing well.”
Large companies face the same problem at a different scale
Large organisations may have millions of transactions and sophisticated analytics teams.
More data does not automatically produce better understanding.
A national sales increase can conceal weaker regions. Higher revenue can coexist with declining customer retention. More digital transactions can accompany a falling average ticket size.
Management needs to segment demand by geography, channel, category, customer cohort, frequency and purchasing occasion.
The question is no longer simply how much was sold.
It is who bought, when, through which channel and for what purpose.
There is opportunity in understanding the context
Changing spending patterns do not only create risk.
Greater mobility can create opportunities for portable F&B concepts, destination products, events and community partnerships.
More digital transactions give small businesses increasingly useful transaction records.
More selective customers increase the importance of branding, communication and clear product positioning.
More channels create opportunities to understand how customers move between physical and digital purchasing.
The opportunity emerges when companies stop treating “the Indonesian consumer” as though it were one individual with one behaviour.
What the data cannot yet tell us
The Q2 data are not sufficient to establish a permanent shift from goods consumption toward experiences.
Monthly retail contraction does not prove that national purchasing power is collapsing.
A lower consumer-confidence reading does not indicate pessimism because the index remains above the 100 threshold.
And a roughly doubling of QRIS transaction volume certainly does not prove that consumers are spending twice as much money.
These qualifications matter.
Economic data should be used to generate better questions—not predetermined conclusions.
Consumers have not disappeared. They may simply be choosing more carefully.
The message from Q2 is not that Indonesian households have stopped spending.
Consumption continues to grow.
Consumer confidence remains optimistic.
Mobility and digital transactions remain active.
But the consumer wallet has many competing destinations.
Businesses waiting only for “purchasing power to recover” may overlook a more immediate change happening in front of them.
The task is not simply to sell more.
It is to understand why customers choose one expenditure while postponing another.
In an increasingly transparent and connected market, the winner will not always be the company offering the deepest discount.
It may be the business that recognises small changes in customer choice before everyone else does.
Sources:
- [1] Badan Pusat Statistik — Indonesia’s Economic in Q2-2026 was 5.29 Percent (Y-on-Y), 5 August 2026.
- [2] Bank Indonesia — Retail Sales Survey June 2026: Retail Sales Expected to Remain Stable, 9 July 2026.
- [3] Bank Indonesia — Consumer Survey, June 2026.
- [4] Badan Pusat Statistik — Tourism Statistics, May 2026, 1 July 2026.
- [5] Bank Indonesia — BI-Rate Held at 5.75%, 22 July 2026.
- [6] Reuters — Indonesia’s Economic Growth Slows to 5.3% in Q2, but Beats Forecast, 5 August 2026.
- [7] BPS Statistical Metadata — Pengeluaran Konsumsi Rumah Tangga.
Published: August 8, 2026
Source and editorial notes are managed through GATICORP CMS.