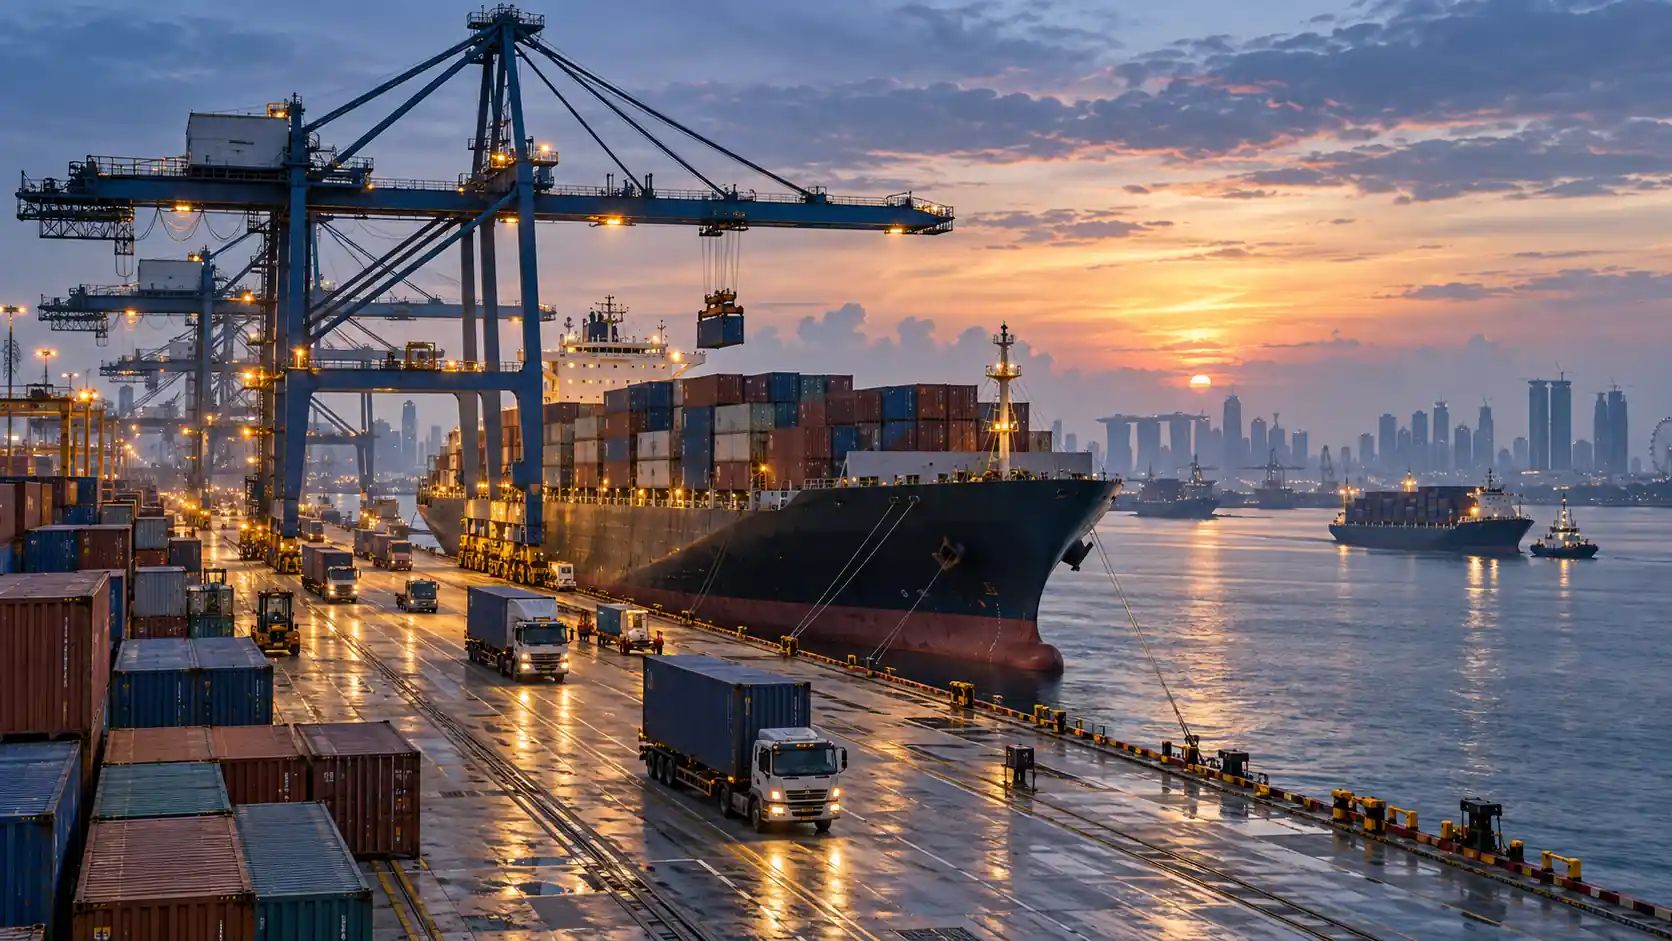

Imports are easy to frame simplistically.
Exports are good.
Imports are bad.
Indonesia’s July 2026 import bill reached US$26.09 billion, up 27.02% year on year.[1]
At first glance, that can look like a sharp increase in dependency on foreign goods.
The composition tells a different story.
Approximately US$18.76 billion of July imports consisted of raw and auxiliary materials.
Capital goods were around US$5.10 billion.
Consumer goods were roughly US$2.24 billion.[2][3]
Most imported goods therefore do not go directly into household consumption.
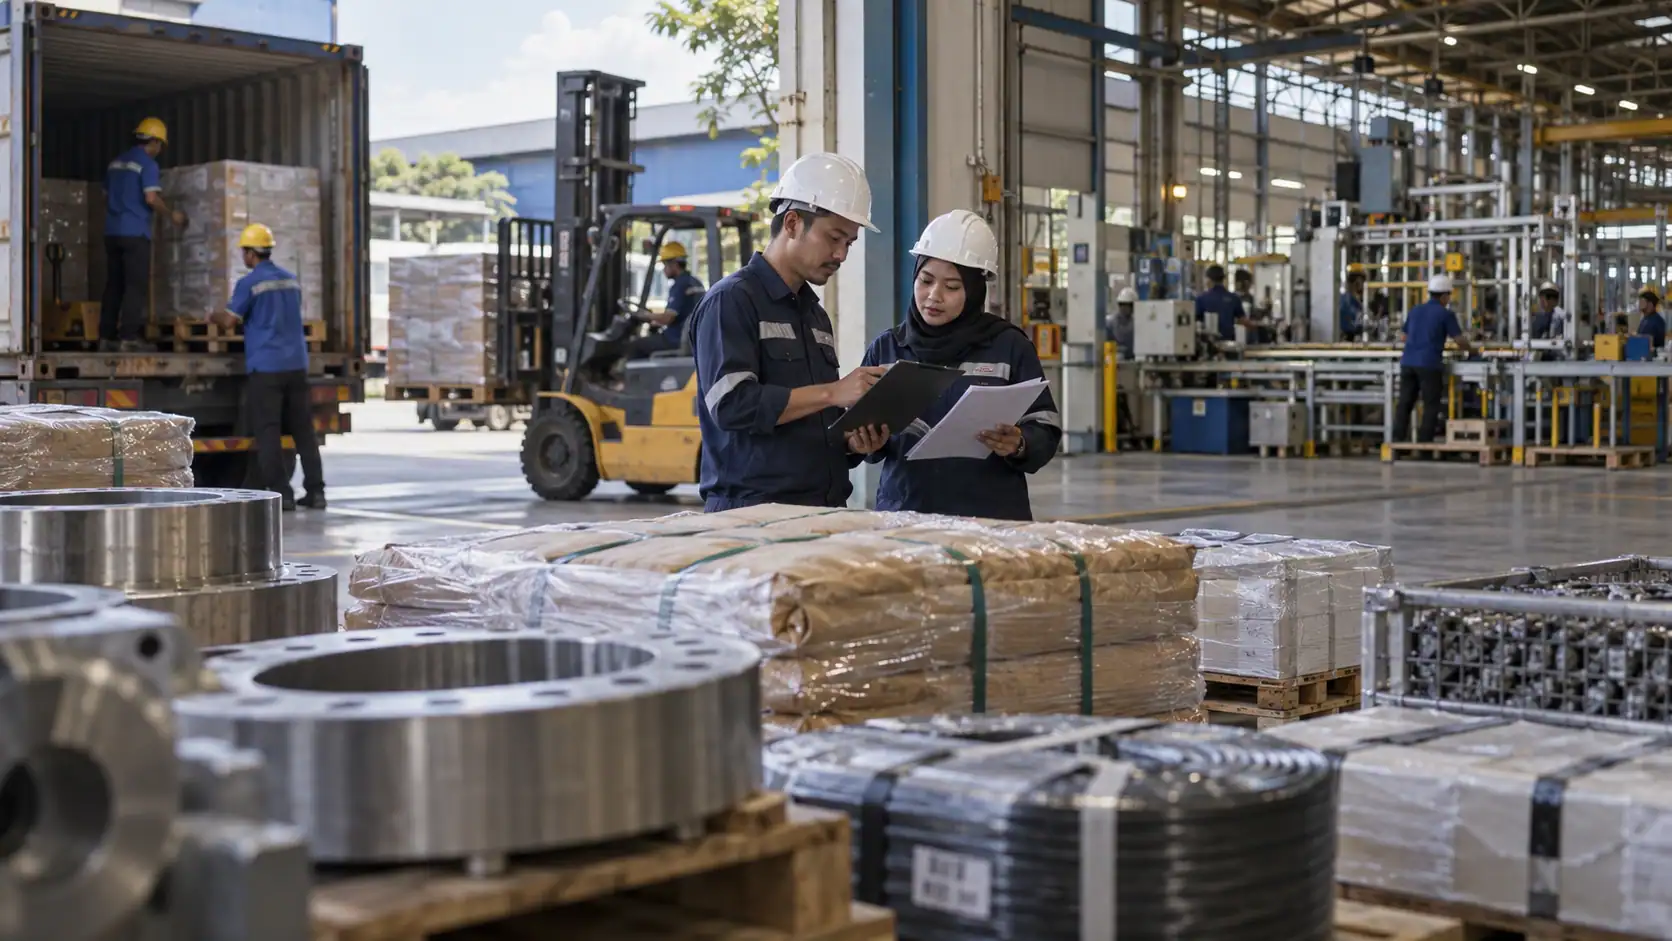
They flow into factories, equipment, supply chains, energy systems and production.
The useful question is not simply:
“Why are imports rising?”
It is:
“What is being imported, what does it enable, and what new risks does it create for business cost structures?”
More than 91% supports production or investment
Indonesia imported US$163.33 billion of goods during January–July 2026, up 19.94% from the same period last year.[1]
Raw and auxiliary materials represented about 71.45% of the total, or US$116.70 billion.[2]
Capital goods contributed 19.88%, or around US$32.46 billion.[2]
Consumer goods accounted for only 8.67%.[2]
Combined, inputs and capital goods represented 91.33% of total imports.[2]
This does not prove every imported item is productive.
It does show that the import surge is not primarily a story about households buying foreign finished products.
Industrial inputs drove much of July’s increase
Raw and auxiliary material imports rose roughly 32.33% year on year in July.[3]
Capital goods increased around 17.38%.
Consumer goods increased about 10.50%.[3]
The strongest growth therefore occurred in business inputs.
That can mean chemicals, components, machinery, packaging materials, industrial equipment and other goods feeding domestic production.
Imports can therefore rise because economic activity is becoming more intensive, not only because domestic producers are losing market share.
Capital goods can indicate investment
Capital goods deserve particular attention.
Machinery and production equipment are generally purchased because businesses expect future output or productivity.
Capital-goods imports grew approximately 20% in January–July compared with the same period last year.[2]
The Indonesian government interprets stronger raw-material and capital-goods imports as a signal consistent with higher domestic production and investment activity.[2]
That interpretation is reasonable.
But it should not be turned into a certainty.
Imported machinery can sit idle.
Projects can be delayed.
Demand can weaken.
Investment creates economic value only when the assets eventually improve output, efficiency, quality or capacity.
Energy remains a major external exposure
The July increase was not purely non-oil and gas.
Oil and gas imports reached around US$3.77 billion, rising almost 49.91% year on year.[3]
Non-oil and gas imports stood at US$22.33 billion, up 23.83%.[1]
For January–July, oil and gas imports reached US$25.77 billion, increasing around 40.24%.[2]
This matters because energy imports affect foreign-currency demand and the trade balance.
Indonesia recorded a US$22.45 billion non-oil-and-gas trade surplus over the first seven months of 2026, but an oil-and-gas deficit of US$18.75 billion.[1]
The resulting total surplus was only US$3.70 billion.[1]
July’s trade surplus was narrow
Indonesia posted a July surplus of just around US$0.12 billion.[4]
Exports were US$26.22 billion.
Imports were US$26.09 billion.[1]
Bank Indonesia said the month included a US$3.10 billion non-oil-and-gas surplus, offset by a US$2.98 billion oil-and-gas deficit.[4]
The balance remains positive.
But it shows how much the energy deficit can absorb the strength of non-oil-and-gas exports.
China remains a dominant supplier
China accounted for approximately 42.38% of Indonesia’s non-oil-and-gas imports during January–July 2026.[2]
That scale offers efficiency.
China provides broad industrial supply chains, competitive manufacturing and deep component availability.
But concentration also creates resilience questions.
Shipping disruption, geopolitical tension, trade restrictions or production issues in one major source country can have a disproportionate impact on Indonesian companies.
The cheapest supply chain is not always the most resilient supply chain.
Imports do not automatically mean local industry is losing
Another common misconception is that imports and domestic production are always substitutes.
Often they are complements.
A locally manufactured product can contain imported machinery, chemicals, electronic components or packaging.
Automotive and electronics supply chains are particularly global.
The more relevant question is how much value added is ultimately created domestically.
A company can import inputs and still manufacture, employ, distribute and innovate in Indonesia.
Productive imports still create risk
The fact that many imports are business inputs does not remove risk.
It changes the type of risk.
Imported inputs create FX exposure.
They can increase lead times.
They can create supplier concentration.
They introduce freight and logistics exposure.
They can become sensitive to customs rules and trade regulation.
For CFOs and procurement teams, those risks need to be managed alongside purchase prices.
Imports also consume working capital
A less visible consequence is working-capital pressure.
Importers often pay for goods before they convert back into sales cash.
There is production time.
Shipping.
Customs clearance.
Warehousing.
Distribution.
Receivables.
The longer the cycle, the longer cash remains tied up.
A fast-growing importer can therefore face liquidity pressure even while revenue is increasing.
Build a landed-cost bridge
Purchase price is only part of the economics.
Businesses should separate:
supplier cost;
FX conversion;
freight;
insurance;
duties and tax;
customs and handling;
warehousing;
financing costs;
and domestic logistics.
The result is landed cost.
This allows management to understand whether margin pressure came from suppliers, currencies, freight or regulation.
Not every import risk needs hedging
Currency exposure may need FX hedging.
Supplier concentration may need diversification.
Long lead times may require safety stock.
Price volatility may justify different contracts.
Some components may be localised.
The response depends on the risk.
Localisation is not automatically better
Replacing imported inputs with domestic sources can strengthen resilience.
But the economics still matter.
Quality.
Reliability.
Available volume.
Lead time.
Total logistics.
Compliance.
Local sourcing is most valuable when it combines competitive cost with dependable quality and supply.
Five indicators businesses should monitor
Imported input share: how much of COGS depends on imported materials?
FX exposure: how much foreign-currency liability remains unhedged?
Supplier concentration: how many critical suppliers are concentrated in one country?
Lead time: is inventory staying longer because import cycles are lengthening?
Margin pass-through: how much higher landed cost can be passed into selling prices before demand weakens?
The import surge is a signal, not a verdict
A 27.02% annual increase looks dramatic.[1]
But the composition shows a more nuanced story.
Indonesia’s imports remain dominated by production inputs and capital goods.[2]
That can support domestic industrial activity and investment.
At the same time, it exposes businesses to currency, energy, supplier and working-capital risks.
Imports are therefore neither automatically good nor automatically bad.
The strategic question is:
Does what we import create more value than the cost and risk it brings into the business?
That is where national trade statistics become procurement, treasury and supply-chain strategy.
- [1] BPS-Statistics Indonesia. July 2026 Export and Import Release, 1 September 2026. (bps.go.id)
- [2] Ministry of Trade of the Republic of Indonesia. July 2026 trade analysis: raw/auxiliary materials 71.45%, capital goods 19.88%, consumer goods 8.67%. (kemendag.go.id)
- [3] BPS July data on imports by use and oil/gas category, as reported from the official release. (antaranews.com)
- [4] Bank Indonesia. “Trade Surplus Recorded in July 2026.” 1 September 2026. (bi.go.id)
- [5] BPS-Statistics Indonesia. Foreign Trade Statistical Import of Indonesia 2025. (bps.go.id)
- Editorial Notes:
- Growth in raw-material and capital-goods imports is consistent with productive activity, but does not prove an equivalent increase in output or investment.
- BPS import values are reported on a CIF basis.
- The merchandise trade balance should not be treated as equivalent to Indonesia’s current-account balance.
Published: September 15, 2026